The latest release of Is It SQL is out and includes a variety of features. I’d like to start with some screen shots of previous features. First up is database mirroring. You can see the mirroring status of a database when looking at the databases for a particular server.
For each database it will show the role, whether it’s synchronized or not, and whether the safety is on or off (synchronous vs. asynchronous). It will also show the send and redo queue for the database.
If you sign up for the newsletter (on the Is It SQL page) it will send instructions on enabling the Enterprise features. That includes a page showing all mirrored databases across all servers you’re monitoring. That page includes a “Priority” column that brings any database with issues to the top. If it’s disconnected or has a send or redo backlog it will bring it to the top of the list. If you have instances under multiple names, for example static DNS entries pointing to mirroring partners, it only shows each database once. That gives you a quick way to see all mirrored databases across your enterprise.
All tables are sortable by clicking on their heading. So you can sort these pages by the send queue or redo queue or the priority value I calculate or the database size or server or any other column. The size of the log also moved to its own column so it’s sortable now.
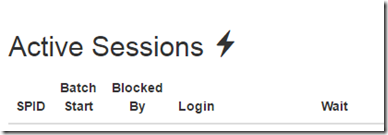
All the data is polled every minute from the servers and then displayed back on the web page. The pages auto-refresh every minute. Some data is polled in real-time when you refresh the page. This is indicated with a cool little lightning bolt by the section.
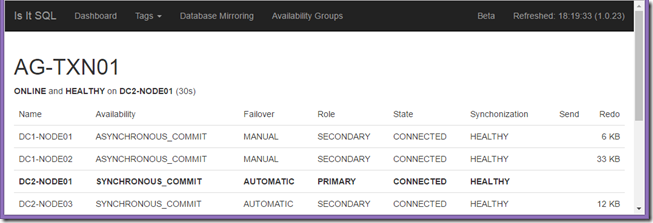
The availability group monitoring is still pretty basic at this point. After you add the nodes to be monitored it discovers any availability groups and displays them all together on a page. The data comes from the AG DMV’s. It is nice to have them all in one place and as easy to access as a web page.
The list of servers was just showing the bytes per second read and written for disk I/O. I’ve expanded this to include the IOPS, average I/O size, and the average latency. It includes that for both reads and writes. 318ms reads. Yuck. I hope yours are better!
At the bottom of each list of servers there’s a summary. It shows the total disk I/O, batches per second, RAM used, data file size and log files size. If instances are included multiple times it only includes it once. This also works for various tags. For example, I’ve tagged servers based on their data center so it’s easy to see how much traffic each data center is taking.
And that’s where we are so far. It’s a handy little utility all in a single 12MB executable. It’s easy to run as a service so it’s always available. I encourage you to sign up for the newsletter. It includes information on enabling the Enterprise features, tips and tricks, and new releases. You can download it from the Is It SQL page.


