People have uploaded nearly one millions rows of trace data to TraceTune. That’s enough data to start to look at the results in aggregate. The first thing I want to look at is logical reads. This is the easiest metric to identify and fix.
When you upload a trace, I rank each statement based on the total number of logical reads. I also calculate each statement’s percentage of the total logical reads. I do the same thing for CPU, duration and logical writes. When you view a statement you can see all the details like this:
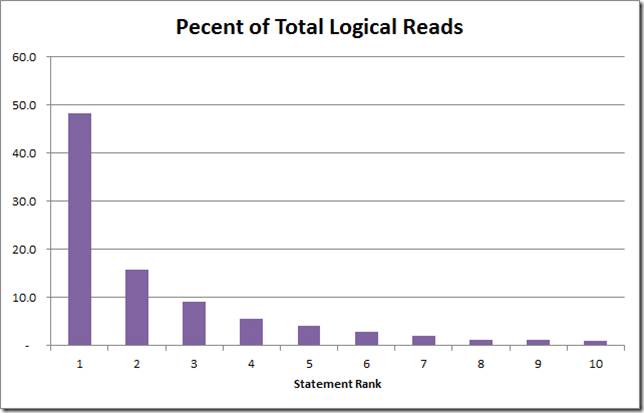
This single statement consumed 61.4% of the total logical reads on the system while we were tracing it. I also wanted to see the distribution of reads across statements. That graph looks like this:
On average, the highest ranked statement consumed just under 50% of the reads on the system. When I tune a system, I’m usually starting in one of two modes: this “piece” is slow or the whole system is slow. If a given piece (screen, report, query, etc.) is slow you can usually find the specific statements behind it and tune it. You can make that individual piece faster but you may not affect the whole system.
When you’re trying to speed up an entire server you need to identity those queries that are using the most disk resources in aggregate. Fixing those will make them faster and it will leave more disk throughput for the rest of the queries.
Here are some of the things I’ve learned querying this data:
- The highest ranked query averages just under 50% of the total reads on the system.
- The top 3 ranked queries average 73% of the total reads on the system.
- The top 10 ranked queries average 91% of the total reads on the system.
Remember these are averages across all the traces that have been uploaded. And I’m guessing that people mainly upload traces where there are performance problems so your mileage may vary.
I also learned that slow queries aren’t the problem. Before I wrote ClearTrace I used to identify queries by filtering on high logical reads using Profiler. That picked out individual queries but those rarely ran often enough to put a large load on the system.
If you look at the execution count by rank you’d see that the highest ranked queries also have the highest execution counts. The graph would look very similar to the one above but flatter. These queries don’t look that bad individually but run so often that they hog the disk capacity.
The take away from all this is that you really should be tuning the top 10 queries if you want to make your system faster. Tuning individually slow queries will help those specific queries but won’t have much impact on the system as a whole.

