I've been making small improvements in IsItSQL and finally released a new version. You can download it at https://www.scalesql.com/isitsql/.
The goal of the application is for non-SQL Server experts to be able to see quickly if SQL Server is having a problem. It also works for my clients to send screen shots so I can see what is happening.
The new features fell into a broad range of categories.
Waits
Prior to 2.0, waits were captured every minute from sys.dm_os_wait_stats which means we only saw the wait when it ended. Starting in 2.0, waits are polled every second from running processes and the page is updated every minute.
This means we only see waits for user sessions and don't include waits for background processes. This shows fewer waits, but they are timely and actionable. There is a server wait page at /server/:server_key/w2 that compares the two waits.
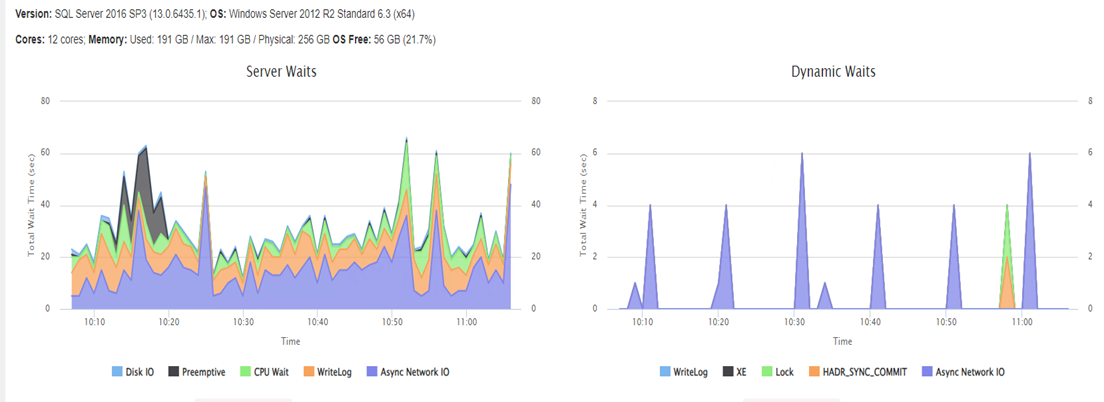
The Waits on the left are the old-style waits for all processes – including background sessions. The Waits on the right are polled every second and only show the Waits from user sessions.
Blocking
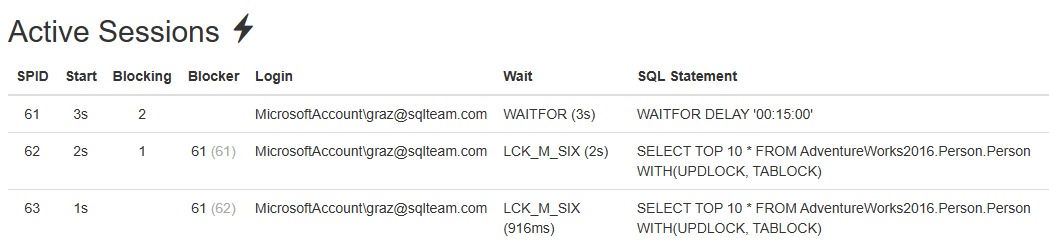
The application displays better blocking information. The sessions are listed by how many other sessions they are blocking. For each session, it shows the root blocker and the immediate blocker (greyed out). This refreshes in real-time as you refresh the page. It also displays orphaned sessions that are blocking.
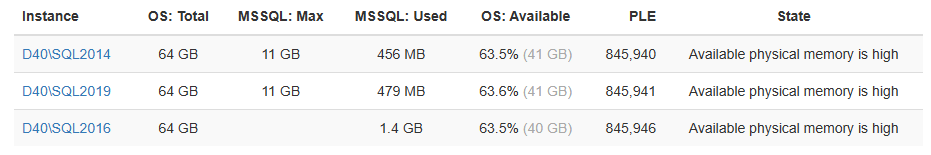
Memory Reporting
- There is a memory page at
/memorythat lists all the SQL Servers, OS memory, SQL Server memory maximum, used, and OS memory free. I find I have problems if I let OS Available Memory get below 5%.
File Configuration
Many of my clients run multiple parallel data centers. Keeping multiple instances up to date is annoying and tedious. This version allows the list of monitored servers to be stored in multiple HCL files. Those files look like this:
server "D40\SQL2016" {
  tags = ["newer", "prod", "dashboard"]
  credential = "sqlmonitor"
  key = "d40-sql2016"
}
Servers can be grouped however you like. We use Puppet to push these files to all the servers that run IsItSQL. We have files for development and then production for each business unit. This gives you cool URLs like isitsql.corp.com/servers/d40-sql2016 if you set the key.
You can also use this feature to assign friendly names to Availability Groups. There are more details in an optional folder in the ZIP file as well as a linter to help with editing the files before pushing.
Other
- The Availability Group page now has a link to JSON output. We use this for simple alerting for heath state – for example, online but not healthy. It also displays the first Listener name instead of the AG name. It displays the send and redo queue sizes. Warning and Alert thresholds can be configured for those values.
- On the database page, if a database is in an Availability Group, it displays the role, health, and send and redo queue sizes.
- Improved support for SQL Server on Linux throughout the application.
- Added a Server Connection Detail page at
/server/:server_key/connthat shows if you are getting a Kerberos connection. - Improved reporting of
tempdbsize. - The OS version is shown in more places. In the screen shot for Waits above, The Windows version and architecture are shown. This should also work for Linux and containers. There is a SQL Server Versions page that lists the SQL Server Version, Edition, OS Version, installed date, cores, and memory. That can be downloaded as a CSV.
- SQL Servers running in containers ignore the "Other" CPU category.
- The application now uses the native GO SQL Server driver supplied by Microsoft instead of the ODBC driver.
- The waits and metrics persist between restarts. They also display per minute which helps if servers don't poll for a time.
- The settings page can limit the settings changes to members of a domain group.