ELK (or Elastic Search, Logstash, Kibana) is taking over one of my clients. And I have to admit it's a very handy tool. They are pushing all their logs into it and it's ver easy to search them.
Fair warning: My ELK skills and knowledge are very rudimentary at this point. Elastic Search is the search engine built on top of Apache's Lucene. Logstash is one of many ways to take in log files and push them into Elastic Search. Kibana is the visualization tool that sits on top of Elastic Search. It's all open source as well as available for purchase through the Elastic Search company. There are also numerous online services providing the ELK stack.
Getting data from SQL Server tables into the ELK stack is straightforward IF the tables have an IDENTITY column -- or any single column, increasing, numeric primary key. You can use the JDBC input plugin for Logstash and import your data. We use this for SSRS execution logs and a few application specific logs.
But I wanted to import SQL Server Extended Events and they use the file name and file offset to keep track of where you are in the file. So I decided to write a little utility to read extended event files and write them to Logstash. Because really, how hard could it be?
Six weeks and 160 commits later, XELOGSTASH is mostly, finally, sort of ready to see the light of day. It's a command-line application and reads extended events, converts them to JSON, and writes them to a Logstash installation.
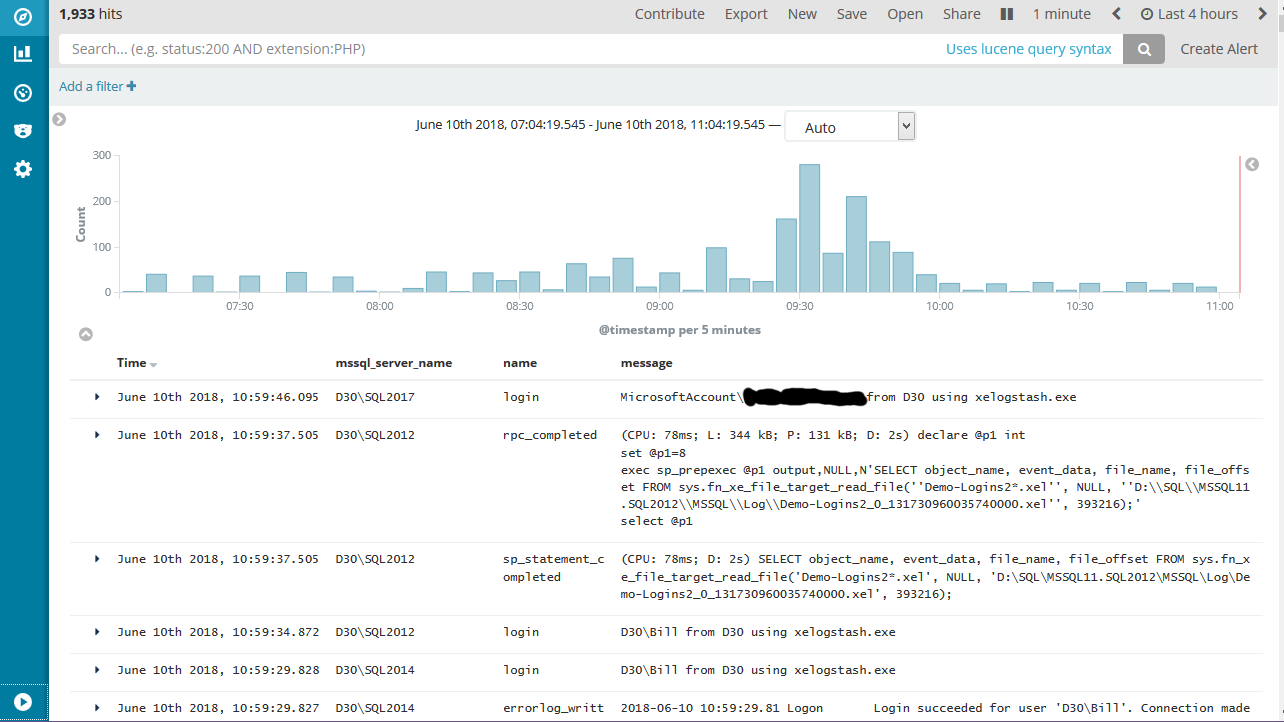
I run it every minute from a SQL Server Agent job and process roughly 30 servers. They generate 1,000 events per minute. Once you get the data in ELK, you get a very basic visualization (this is from my development box).

xelogstash converts extended event data and actions to fields in Elastic Search.
Here are some use cases I've found for this data:
- Find all the servers a domain account uses. Or find all the clients that have connected to any of the nodes of an AG over the last two weeks.
- Show SQL Server exceptions across multiple servers while new applications are being deployed. This is especially helpful for permission errors when applications are deployed using new service accounts.
- Show me the login failures across all my servers
- Show me the SQL Server Error Log and AlwaysOn_health events across all AG nodes in one integrated timeline.
- Show me the timeline of all failed SQL Server Agent jobs for the last week across all servers.
My "little" application ended up doing quite a bit more than just reading extended event files and writing them to ELK.
- It's multi-threaded and can process multiple servers at once. I usually run it at 8 workers to process 30 servers and it never uses more than 10% of a 2 core VM. The initial loads can be much larger but once you get caught up it's very light.
- You have LOTS of control of the JSON. You can rename fields, define common fields, and control the overall structure of the JSON. For example, at one client, all my XE specific fields get nested under an "mssql" field. When testing with some ELK as a Service providers, they wanted all the fields at the root level. That's one line of configuration.
- It enriches the extended event with data such as domain, server name, version, computer, database name from database ID, etc. It also builds a description field where I try to build a single helpful message field. For a SQL statement, that includes the resource usage and part of the SQL statement.
- It can import SQL Server Agent job history for all jobs or just failed jobs. You can do that with a basic query but this also enriches the data as described above.
- It can write it's own log messages to Logstash (of course). As well as standard out and a local log file. Or all three at once.
It's written using the GO language but you can download compiled executables. If you happen to be one of the people using SQL Server and ELK, please give it a try and give me some feedback.
If you just want to test, I used logz.io for testing because they have a free tier. The works best with the following settings:
- Enable
strip_crlf - Copy
xe_descriptiontomessagein the "copies" setting - Set
timestamp_field_nameto@timestamp