I updated TraceTune over the weekend. I increased the trace file upload size to 20MB. We’ve processed over half a million rows of trace data so far and I’m confident this won’t kill the server.
I added average CPU and average disk reads to the screen that lists the SQL statements in a trace file.
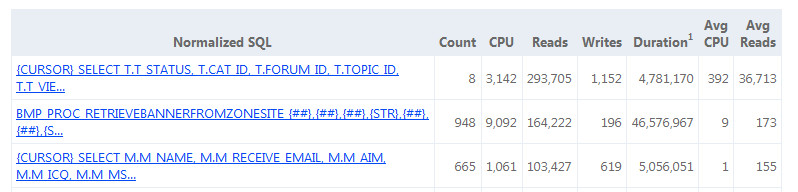
I only added these two. I’m pretty sure average writes isn’t that import. I’m still thinking about average duration. I’m trying to balance showing you what you need with a clean, simple interface. Plus I have a way to see the averages that I describe further down.
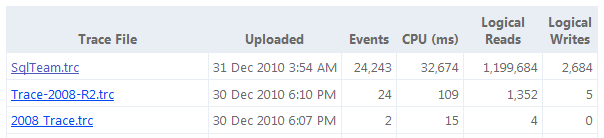
TraceTune now keeps the last 10 files that you’ve uploaded and will give you some basic details about each file.
I think the last change I made is the most interesting. For each SQL statement, I show the history of that statement.
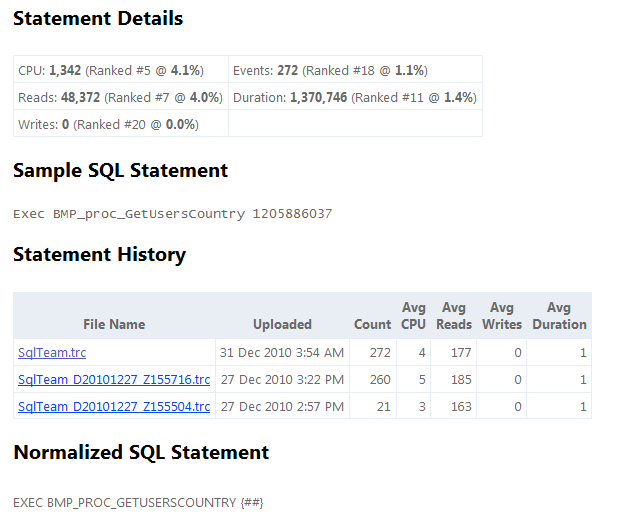
You’ll see each trace file where this statement was found. It will list the averages for CPU, reads, writes and duration. This will quickly show you if you’re improving the performance of that query. In my screen shot above you can that even though the execution counts are very different the averages are consistent.
If you want to see what queries are consuming the most resources on your server give TraceTune a try.