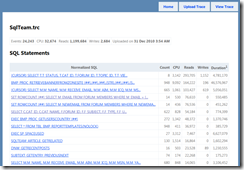
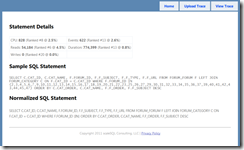
When I visit clients for the first time and conduct a performance review I introduce them to ClearTrace. It’s still the best way I know to identify exactly which queries are consuming the most resources. The downside is that it needs to be downloaded and create a database to store the results. I finally decided it would be easier if I could just upload a trace immediately.
You can find the online version of ClearTrace at TraceTune.com. It provides a simple way to upload a trace file and see exactly which stored procedures or SQL statements consume the most CPU and disk.
This is still a work in progress as I try to determine exactly which features from ClearTrace are important. I’ve also limited the file upload to 10MB in this beta release. That might not sound like much but I get over 20,000 events using this stored procedure to generate the trace.
If you’re looking for something to do on a Friday, I’d suggest a little performance tuning. Generating 10MB of trace data doesn’t take long at all and in a short time you’ll see exactly which SQL statements you need to tune first.

