You can download the latest version of ClearTrace from my consulting site: scaleSQL Consulting.
I’ve decided to stop using the year as part of the version. I did that to match SQL Server branding but it doesn’t work for ClearTrace. The current build supports SQL Server 2008, SQL Server 2008 R2, SQL Server 2012, and SQL Server 2014. It tries to load the most recent SMO and goes backwards until it successfully loads an SMO library. Always use the most recent version of ClearTrace and it should support any current SQL Server.
If you’re having issues with ClearTrace you can visit the new ClearTrace Support Forums. That’s the best place to ask questions or report bugs.
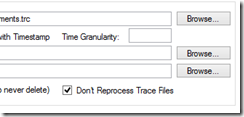
 The latest build adds a number of features. The first is an option that doesn’t reprocess trace files. I regularly generate large traces that have many files and I’m too impatient to wait for them all to finish. The script I use generates a unique name for each trace file. This option allows me to skip the trace files that have already been loaded.
I also fixed a pseudo-memory leak that had been hanging around for a LONG time. One of my early uses of ClearTrace was for a client that had lots of prepared SQL. In the trace file I would find lots of sp_execute 32423445 or some such. That number identifies the prepared SQL statement. ClearTrace captures the statement that prepares that SQL and reports back the actual SQL executed. This was all being stored in memory. Either I wasn’t clearing it properly or I didn’t understand how it got cleared but this structure was ballooning up. I’d regularly fill up memory to just under 2GB and watch the application crash. Now the application clears this structure after each trace file. If you want better handling of prepared SQL just increase the trace file size. That will capture more of the prepared SQL statements.
Trace Groups allow you to group traces together. They are especially helpful to view changes over time. I typically have one trace group per server. I’ve seen users that have dozens and dozens of trace groups with all kinds of fancy names. So I made the Trace Group Name drop down wider and hopefully easier to work with.
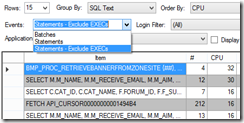
 If you capture statement level traces and you have lots of nested stored procedures you’ll see lots of EXEC statements in your list of statements. If you end up a few layers deep you can see LOTS of EXEC statements. So I added an entry to the Events drop down filter to exclude statements that start with EXEC. All it does is eliminate anything that starts with “EXEC”. So far it’s been helpful.
I also fixed the history tab to work better with statements. And by “better” I mean it actually works now. You should get a statements history without the application blowing up.
(And if you downloaded build 46 please update to build 47. It’s just minor bug fixes around how statements are displayed in the grid. Or not displayed as was happening in some situations.)
And that’s it. Give it a try and let me know any issues in the ClearTrace forums.